
Early 2026 Market Check
Stronger Signals, Slower Closings, and a Few Mixed Messages
MARKET UPDATEPHOENIXCROMFORD REPORT
We’re taking another look at Greater Phoenix market data from the start of 2026 and comparing it with the same point last year. The picture that’s emerging is complicated, but useful.
Several indicators suggest the market is healthier than it was at the beginning of 2025. At the same time, some numbers show the market is still finding its rhythm after a heavy push to close transactions at the end of last year.
Here’s what’s standing out so far.
Three Signals That Are Clearly Positive
Across property types and price points, three important demand indicators are moving in the right direction compared with last year.
Active listings are growing more slowly.
Active listings (excluding homes already under contract) are up 5.5 percent since the start of the year, compared with 8.9 percent growth at the same time in 2025. Supply is still rising, but not as quickly as it did last year, which is a subtle but meaningful improvement.
More homes are going under contract.
Listings under contract are up 14.7 percent year to date, compared with 11.0 percent growth at this point last year. More buyers are actively writing offers, which is one of the best real-time measures of market momentum.
The contract ratio is improving faster.
The contract ratio, which measures how many listings are under contract relative to active listings, is up 8.7 percent so far in 2026, compared with only 2.0 percent growth by this date in 2025. This suggests demand is absorbing inventory more efficiently than last year.
Three Areas That Are Still Lagging
While forward-looking indicators are improving, the numbers that reflect completed transactions are less encouraging.
Closed sales are losing steam, at least for now.
The monthly rate of closed sales is down 24.1 percent from the start of the year, compared with a 14.7 percent drop at this point in 2025. January is typically one of the weakest months for closings, and the market likely saw an unusually heavy push to close deals in December. It would not be surprising to see the sales pace recover by late February.
Active listings remain higher than last year.
Even though supply growth is slowing, the total number of active listings is still 8.9 percent higher than January 2025. The good news is that the gap is shrinking. It started the year at 12.1 percent, so conditions are moving in the right direction.
The contract ratio started lower than last year.
At the beginning of 2026, the contract ratio was 6.1 percent lower than at the same time in 2025. It has now caught up, and we are essentially level with where we were on January 19 last year. That represents progress, but it also confirms that demand is improving, not accelerating dramatically.
Mortgage Rates Are Lower, So Why Isn’t Demand Stronger?
On January 19, 2026, the typical interest rate for a 30-year fixed-rate mortgage was about 6.07 percent. At this time last year, the typical rate was about 7.08 percent. That is a very large difference and would normally be expected to produce much stronger buyer activity than what we are currently seeing.
Despite lower rates, the contract ratio remains around 28, which reflects a relatively cool market.
This suggests that interest rates alone are not the dominant factor shaping buyer behavior right now.
Other Factors That May Be Influencing Buyers
There are several additional forces that could be affecting demand.
Homes are becoming cheaper in real terms.
After adjusting for inflation, prices are not rising the way they were in prior years. When buyers believe prices may decline further, some choose to wait.
Falling rates can also encourage waiting.
When rates start trending downward, some buyers delay purchasing in hopes that financing will become even more affordable in the near future.
Concerns about job security may be playing a role.
Public discussion about AI and automation replacing jobs, even when productivity gains have been limited so far, can still affect consumer confidence. For some households, committing to a long-term mortgage feels riskier when future employment feels uncertain. Renting offers flexibility that homeownership does not.
What the 2025 Annual Data Tells Us
The full-year numbers from 2025 help explain some of the trends we are seeing early in 2026.
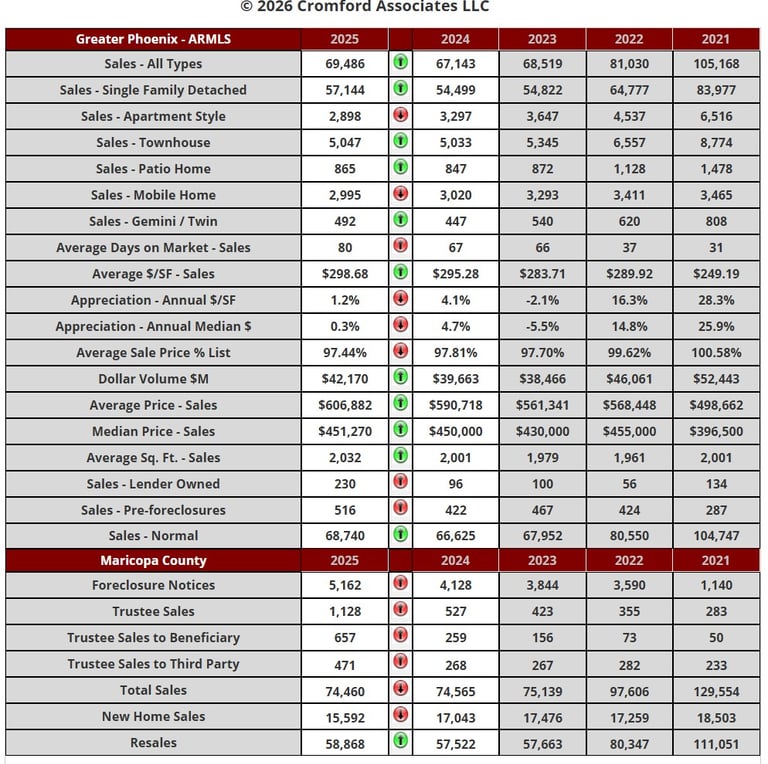
Apartment-style home sales fell while single-family sales increased.
Apartment-style homes sold about 12 percent fewer units than the year before, while single-family detached homes sold about 5 percent more. That is a significant shift away from higher-density housing toward traditional single-family homes.
Completed foreclosures rose sharply, but remain low historically.
Completed foreclosures nearly doubled compared with 2024. While that sounds alarming, the total volume is still relatively low and not yet back to what would be considered normal levels. It is a trend worth monitoring, but not a sign of widespread distress.
Resales increased while new home sales declined.
New home sales fell about 9 percent, while resales increased about 2 percent. This suggests buyers are leaning more toward existing homes, possibly due to pricing, location, or overall value compared with new construction.
Bottom Line
Many indicators suggest the market is stronger than it was at the start of 2025. Demand is improving, inventory growth is slowing, and more listings are going under contract.
However, closed sales remain soft, supply is still higher than last year, and the response to lower mortgage rates has been weaker than expected.
The takeaway is that the market is stabilizing and gradually improving, but broader economic confidence and buyer expectations are playing a bigger role than interest rates alone.
For buyers and sellers, this is a market that rewards good strategy, realistic pricing, and patience more than hype or headlines.
Real Estate CNX Gergen Robinson 253-651-2198
Gergen@GergenRobinson.com
Newsletter
Sign up for our newsletter and get notified about all new posted articles.
cONTACT
SOCIALS